Plain language before numbers
A finding reads as a sentence first; the measurement supports it rather than leading.
Wirescan
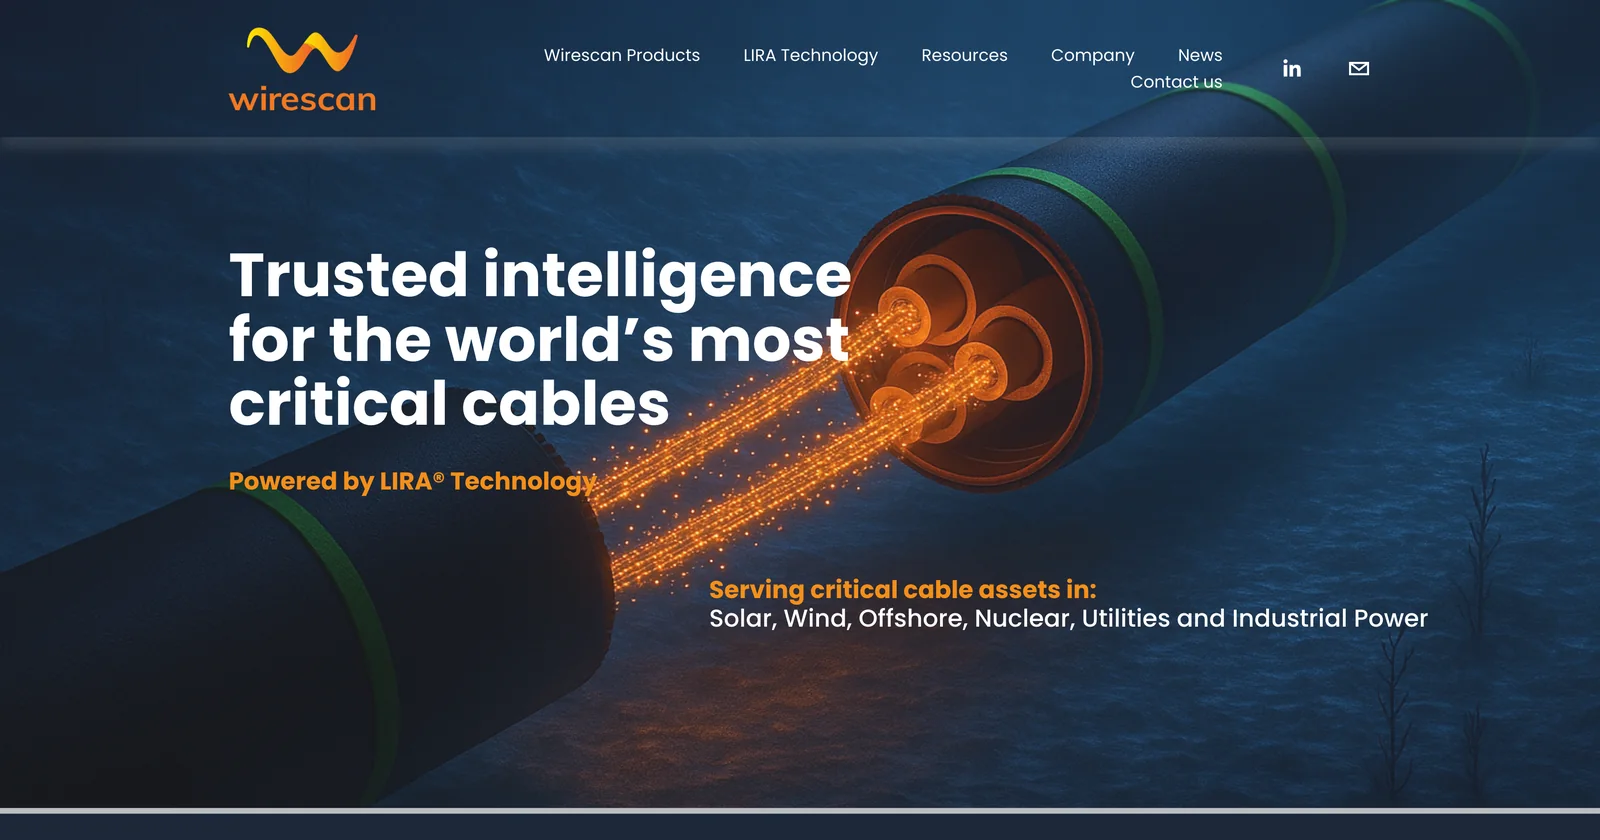
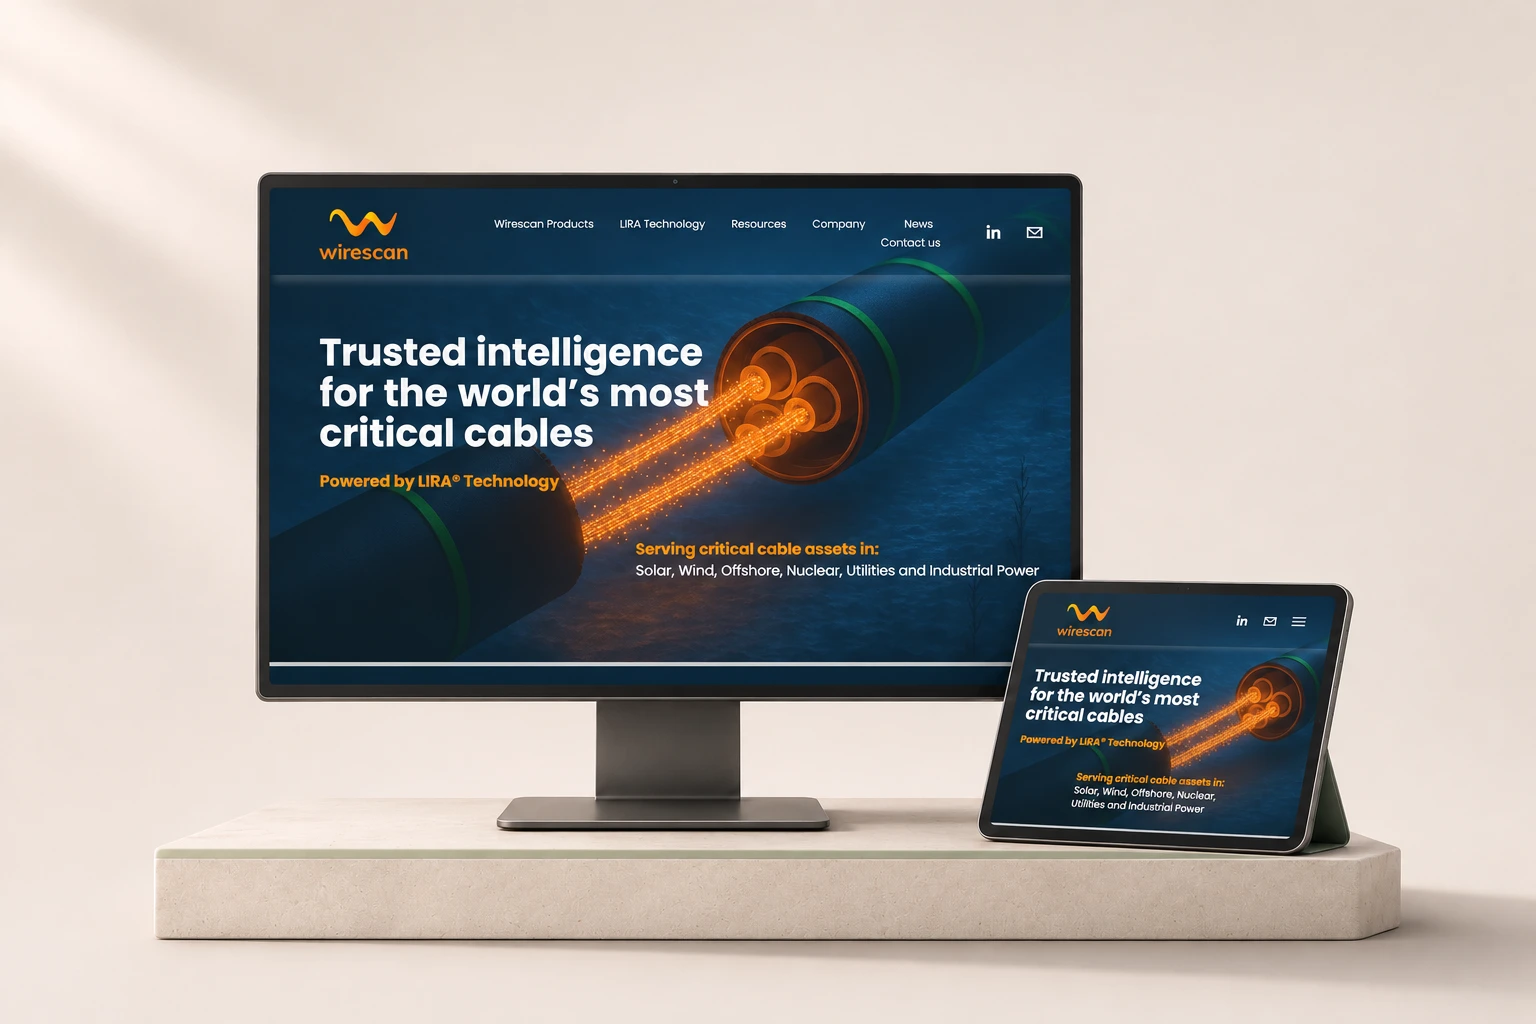
Wirescan builds cable-diagnostics technology for industry. Through Cefalo, I designed its product UX/UI and brand applications, then took the same thinking into spatial prototypes, including a wind-farm digital twin.
Cable condition is invisible: it lives in scans, baselines and readings along a line. The design job was turning that into something an engineer can read at a glance, trust, and act on, on a screen and in a 3D view of the assets.
01The problem
Cables fail slowly and out of sight. The data that predicts it is hard to read.
Wirescan’s technology scans cables and compares the result against a baseline, so a change along the line, such as a joint taking on moisture, shows up before it becomes an outage. That information is precise but abstract: distances, percentages, impedance steps.
The people using it are maintenance and operations engineers. They need to know what changed, where, how serious it is, and what to do next, without decoding a chart first.
The design goal: every finding answers four questions in order. What is it, where is it, how bad is it, and what should I do?
02My part & the team
A client assignment through Cefalo, alongside Wirescan’s team and Cefalo engineers.
03Readable inspection data
The first job was making inspection results readable without colour doing all the work.
04The wind-farm twin
The wind-farm twin puts the same diagnostics in the place they describe.
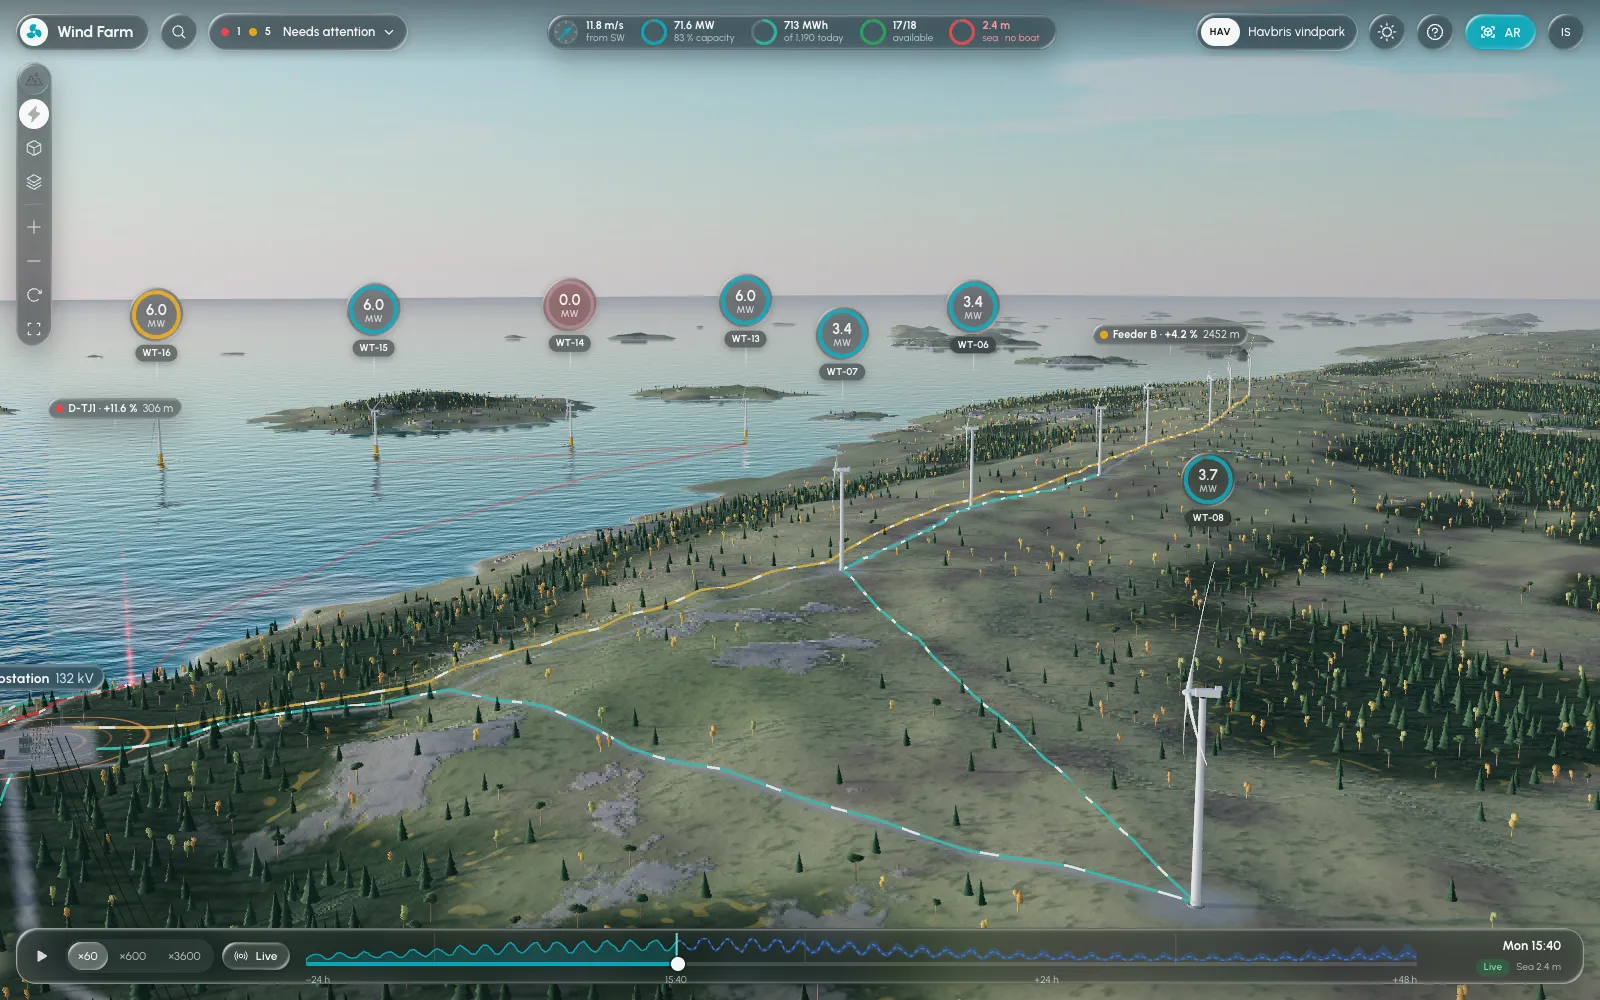
It’s a browser-based 3D model of a coastal wind park: offshore and onshore turbines, the cables between them, the landfall and the substation. Each turbine carries a small label with its current output, and a fault marker sits exactly where the cable scan found the change.
A header keeps the whole park in view (wind, total output, energy today, available turbines, sea state), and a timeline lets an engineer play the day back at 60×, 600× or 3,600×, or return to live.
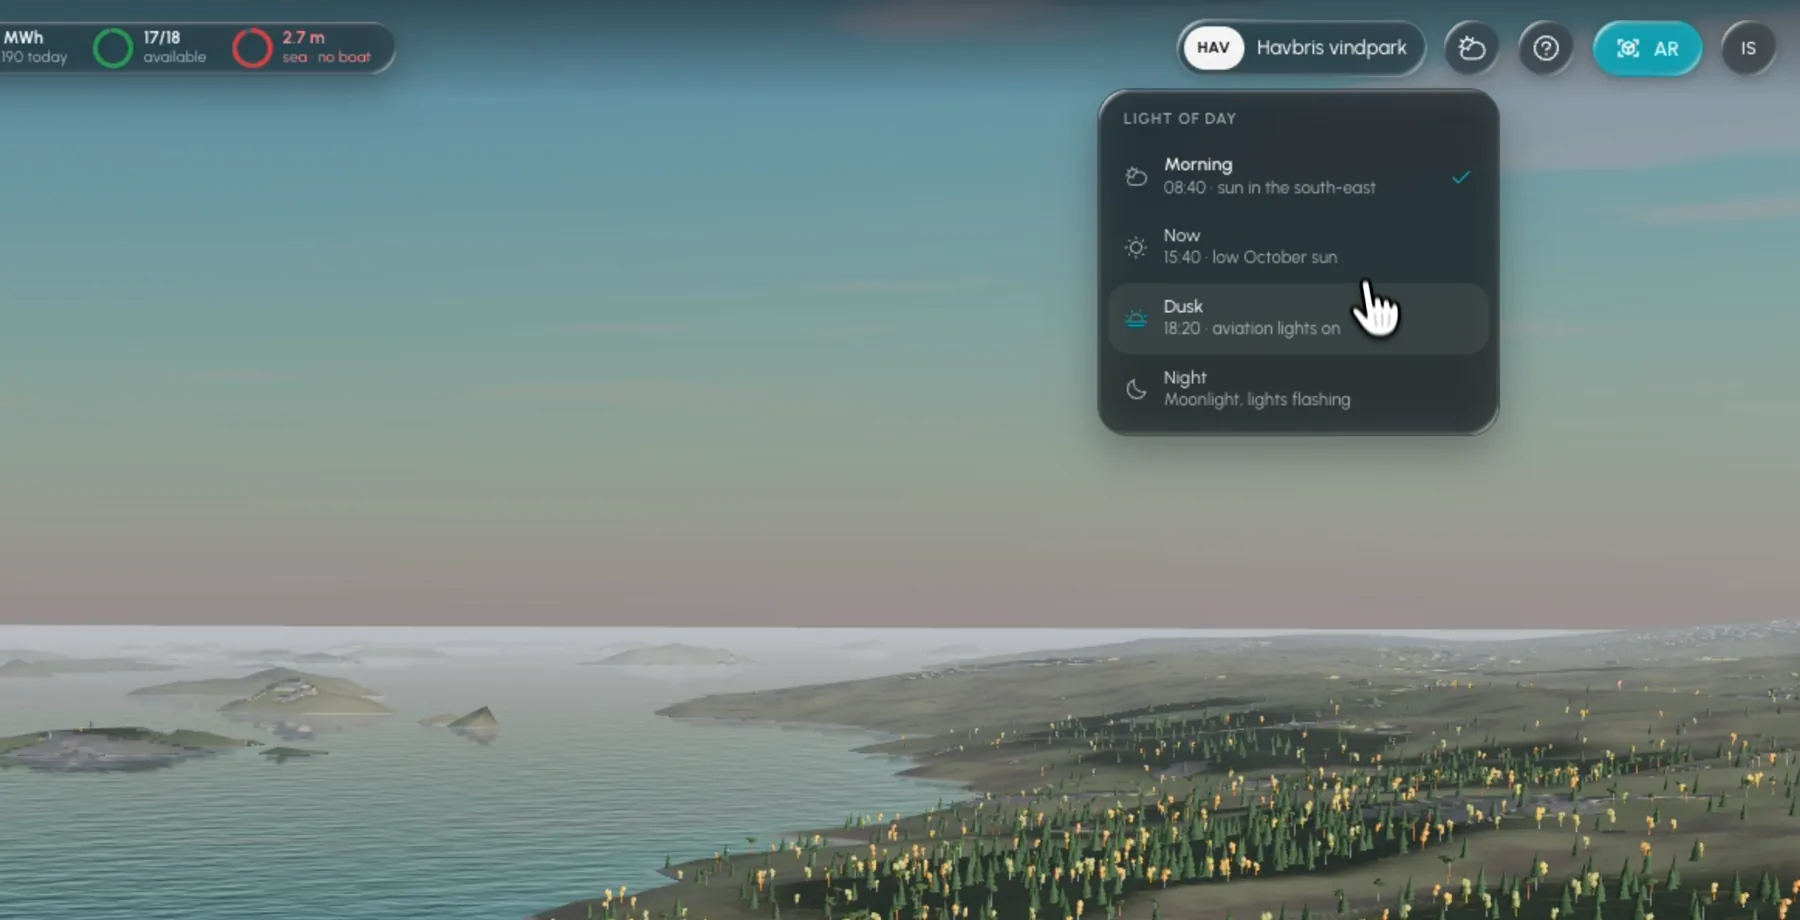
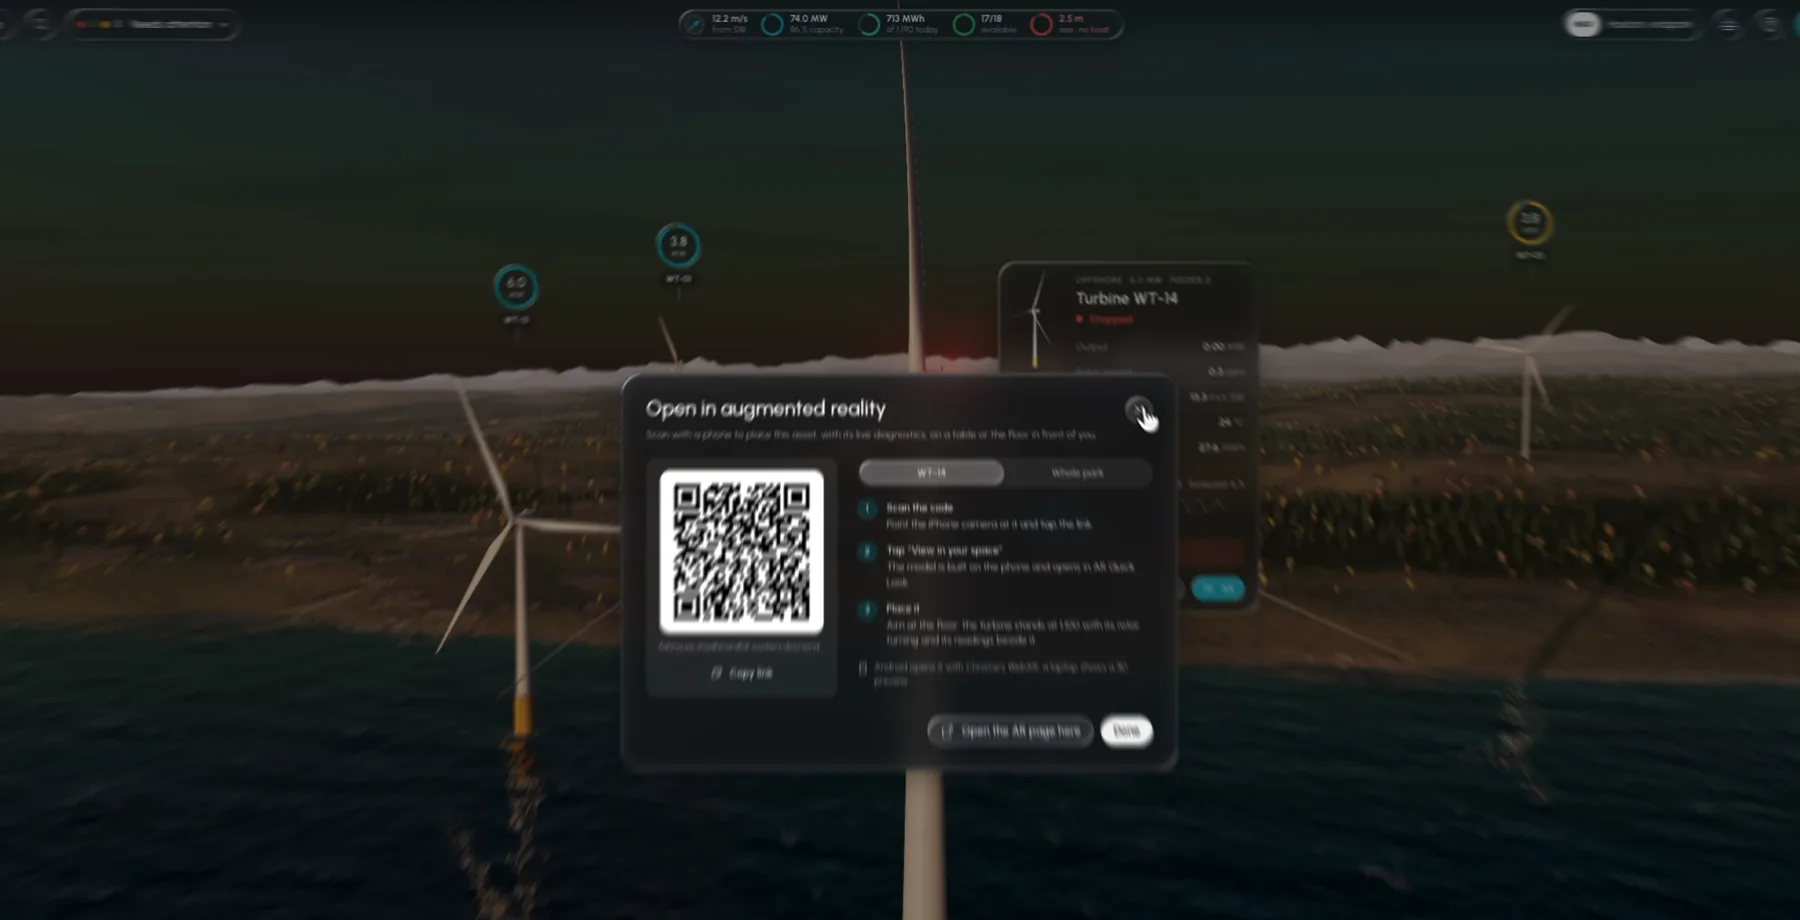
Prototype captured from the running app. Every value shown is simulated demo data.
05Cables & health
Switching to “Cables and health” hides the scenery and shows the network.
Cable routes from each turbine to the substation light up, and feeders with a finding are marked along their length. It turns an abstract line in a report into a route someone can follow, from the turbine to the joint that needs attention.
06Diagnostics to a plan
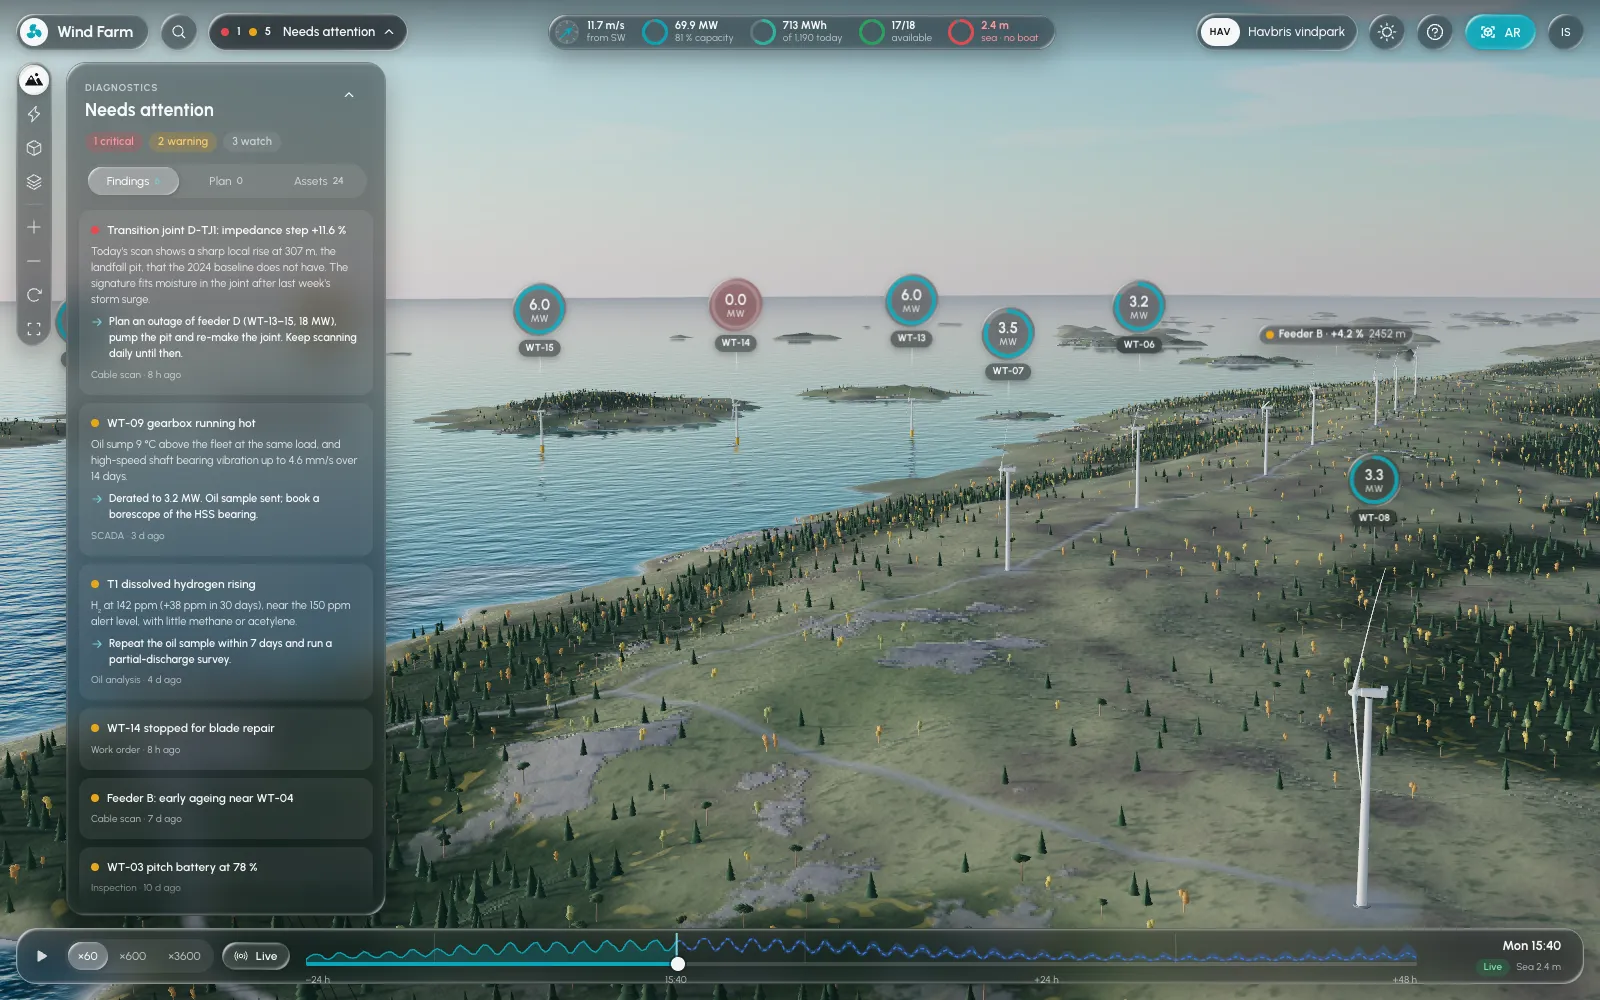
Findings, the plan and the assets live in one panel, ordered by urgency.
The panel opens on a summary (one critical, two warning, three watch), then lists each finding with what was seen, where, how it compares to the baseline, and a recommended step, such as planning an outage and pumping a joint pit. Findings, Plan and Assets tabs keep diagnosis, work planning and the asset list separate but one click apart.
07Inspecting an asset
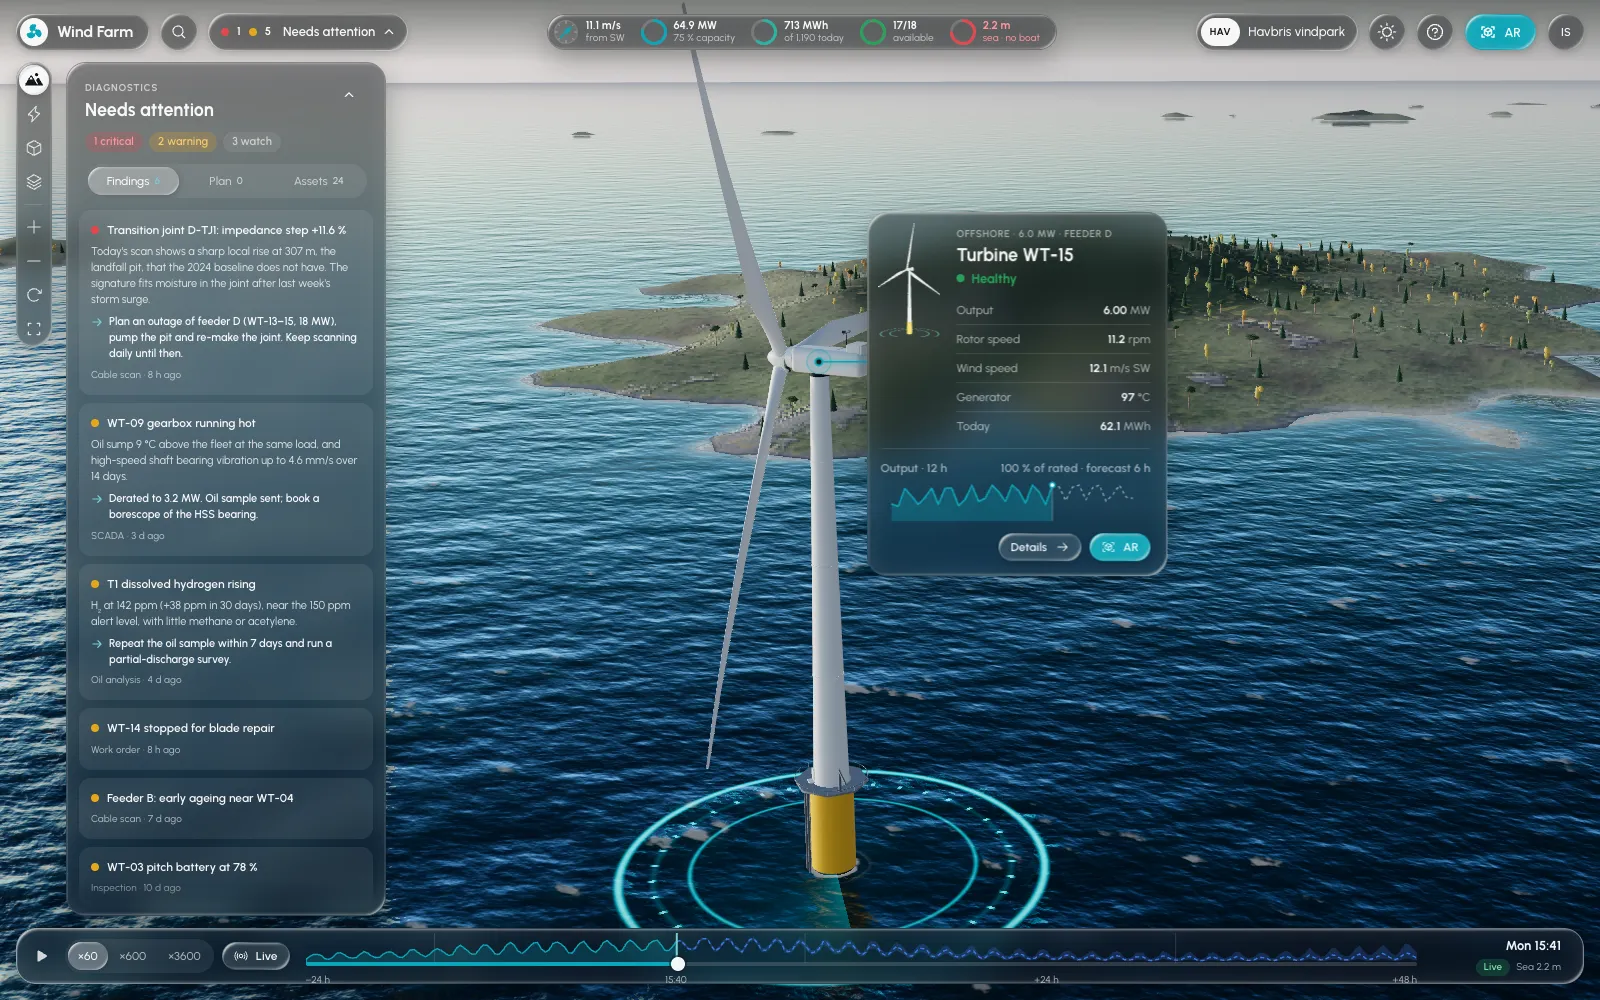
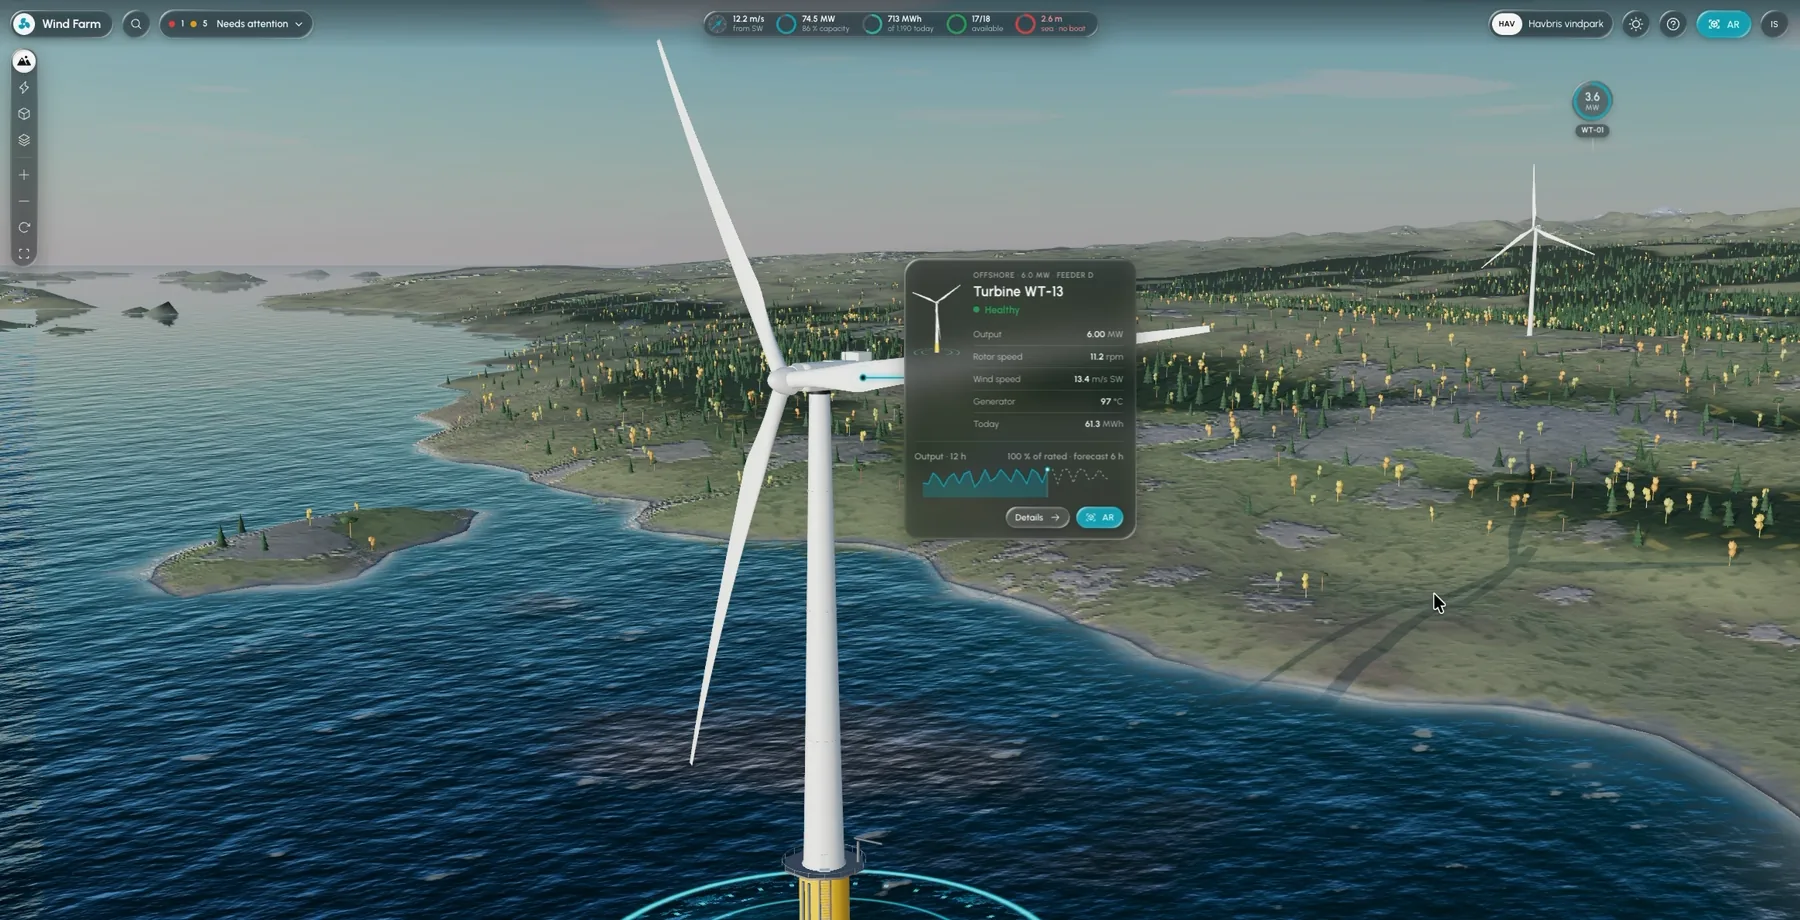
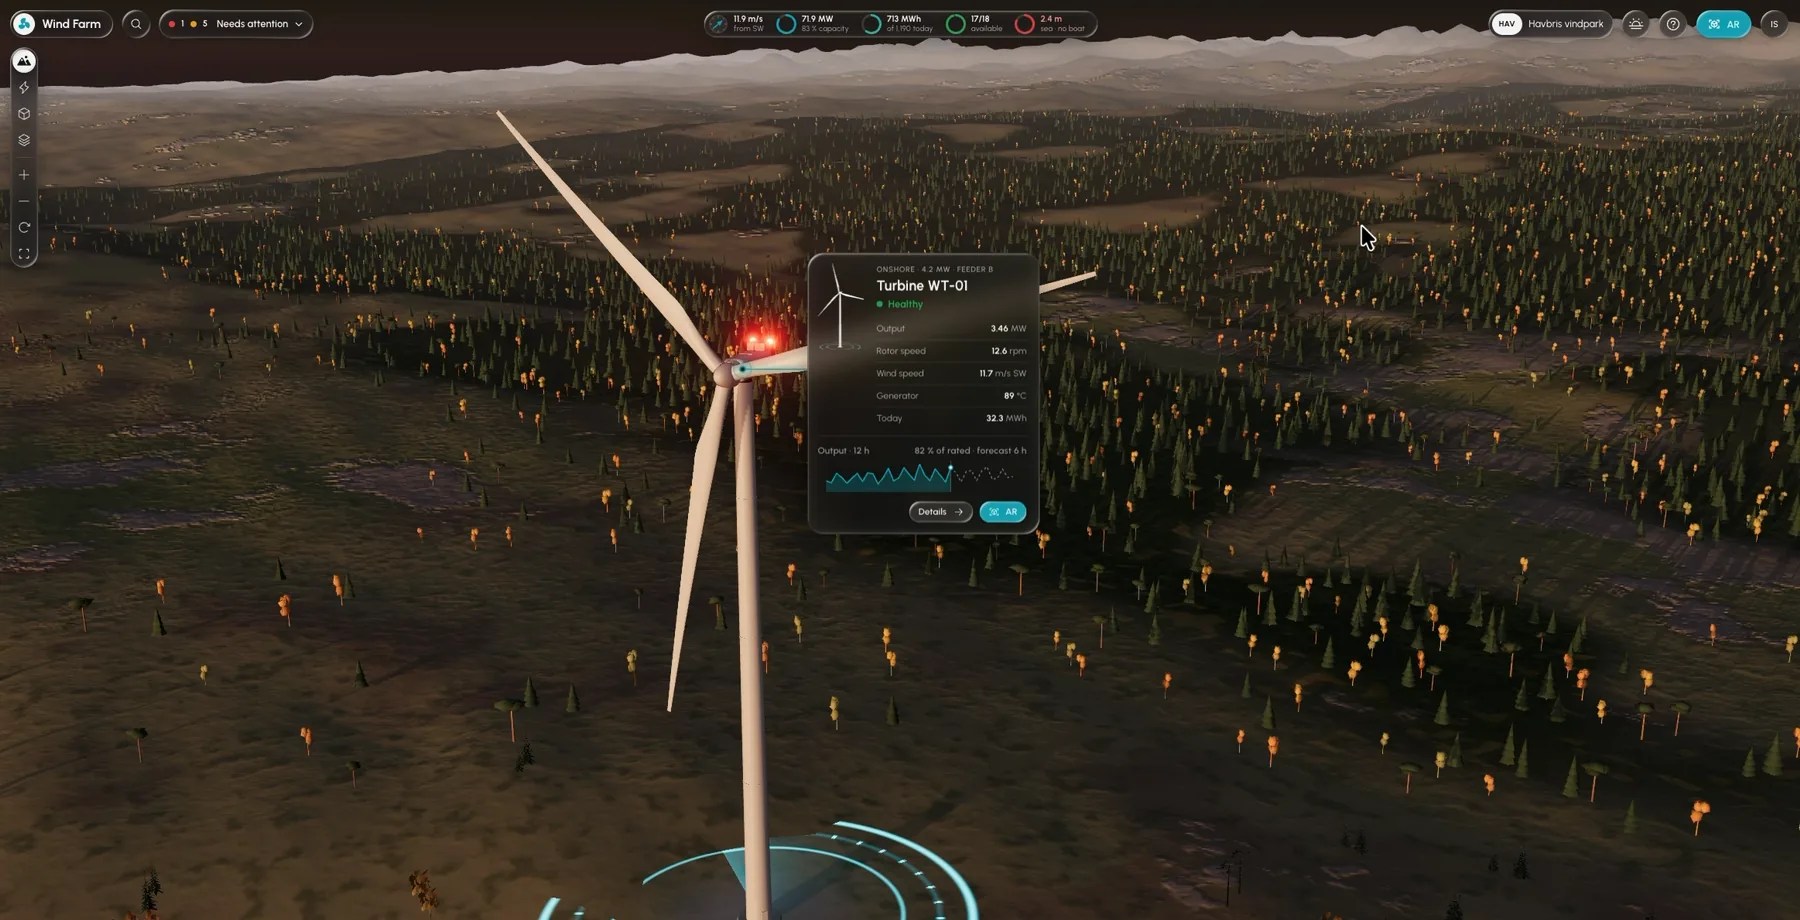
Selecting a turbine opens a compact inspection card on the asset itself.
The card shows the turbine’s status in words, then output, rotor speed, wind, generator temperature and energy today, with a 12-hour output chart against its rated power. Details opens the full record, and AR opens the same asset in augmented reality on a phone, or as a tabletop model.
08Modular components
Behind both the screens and the twin is one set of components.
Status chips, finding rows, metric readouts, asset cards and toolbar controls are designed once and reused, whether they sit in a dashboard, float in a 3D scene or appear in AR. Explicit states (healthy, watch, warning, critical, unavailable) mean a component behaves the same way everywhere, and prototypes in Unity and Three.js test that behaviour beyond static Figma screens.
09Design decisions
Calls that shaped the work.
A finding reads as a sentence first; the measurement supports it rather than leading.
Every status has a word and a marker, so it survives colour blindness, glare outdoors and greyscale printouts.
The twin shows a fault on the cable it affects, instead of in a separate list people have to map back to the site.
Reusing the same status and metric components in 2D and 3D keeps meaning consistent between views.
The twin and AR flows are explorations with simulated data, presented as such.
10Accessibility
WCAG 2.2 AA is the target for the screen interfaces, with APCA as a supplementary readability check. Spatial views also need routes that don’t depend on 3D.
Design targets, not audit results. No formal conformance or safety review is claimed.
11Scope
The wind-farm twin uses simulated data and is not a live monitoring system or a validated predictive-maintenance model. The Unity, WebXR and AR work are prototypes, not a deployed Wirescan product. No operational or financial results are claimed.
Industrial data becomes useful when it reads like a colleague’s note: what changed, where, how serious, and what to do about it.